

Introduction: Understanding the Three Tiers of Selling
The Three Tiers of Selling explain why two salespeople can offer the same product at the same price and still achieve completely different results.
The difference is often not the product itself. Instead, it is how the salesperson communicates value, understands customer needs, and builds trust throughout the buying process.
One salesperson lists specifications and technical details. Another explains how the product will improve the customer’s situation. However, the most successful salesperson goes even further by creating confidence, trust, and a genuine sense of security.
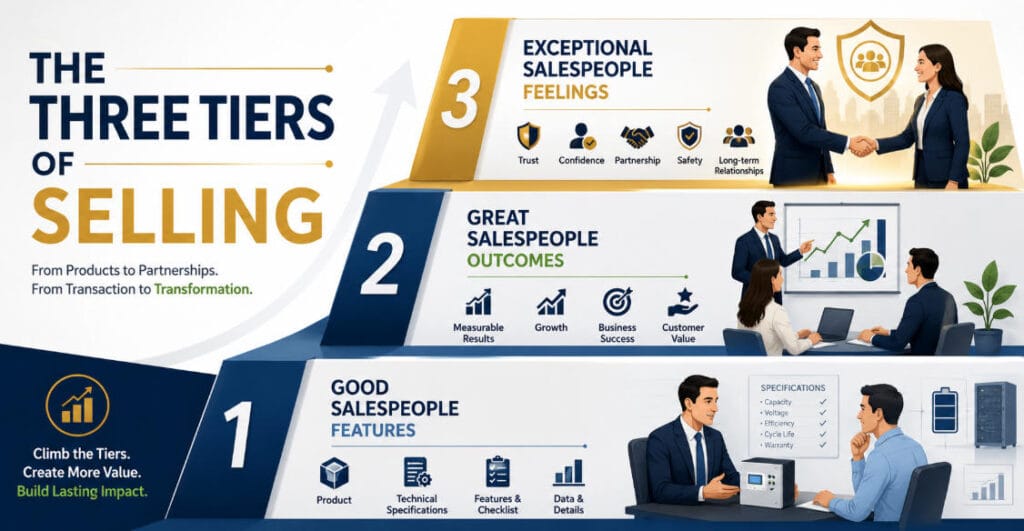
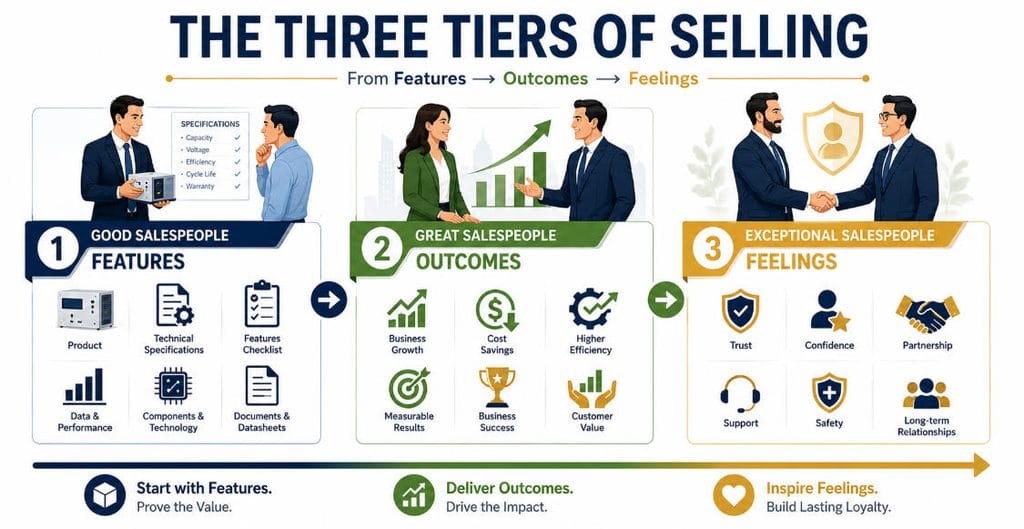
This progression forms the Three Tiers of Selling:
- Good Salespeople focus on Features
- Great Salespeople focus on Outcomes
- Exceptional Salespeople focus on Feelings
The Three Tiers of Selling provide a practical framework for understanding why some salespeople merely explain products while others build strong, long-term customer relationships.
In my experience working with renewable energy, energy storage, lithium batteries, sourcing, procurement, and international business, I have seen that technical knowledge alone does not make someone an exceptional salesperson. Complex B2B sales require the ability to explain product features, connect those features with meaningful customer outcomes, and build the trust that makes customers feel confident in their decisions.
Product knowledge remains essential. However, product knowledge alone rarely creates exceptional sales results.
Customers want answers to three important questions:
- What does the product do?
- What will it help me achieve?
- How will I feel working with you?
Therefore, the strongest sales professionals learn to sell more than specifications. They connect product knowledge with customer outcomes and emotional trust.
What Are the Three Tiers of Selling?
The Three Tiers of Selling represent three levels of sales effectiveness.
Each level focuses on a different part of the customer decision-making process.
| Selling Tier | Primary Focus | Customer Question |
|---|---|---|
| Good Salespeople | Features | What does it do? |
| Great Salespeople | Outcomes | What will it achieve for me? |
| Exceptional Salespeople | Feelings | How will I feel working with you? |
The first tier creates understanding.
The second tier creates value.
The third tier creates trust.
However, exceptional salespeople do not completely ignore the first two tiers. Instead, they combine all three approaches.
First, they understand the product.
Next, they understand the customer’s desired outcome.
Finally, they understand the customer’s concerns, emotions, and expectations.
As a result, they create a more complete and meaningful sales experience.
Tier 1 of the Three Tiers of Selling: Good Salespeople Focus on Features
What Are Features in Sales?
Features describe what a product has, does, or contains.
They are factual characteristics of a product or service.
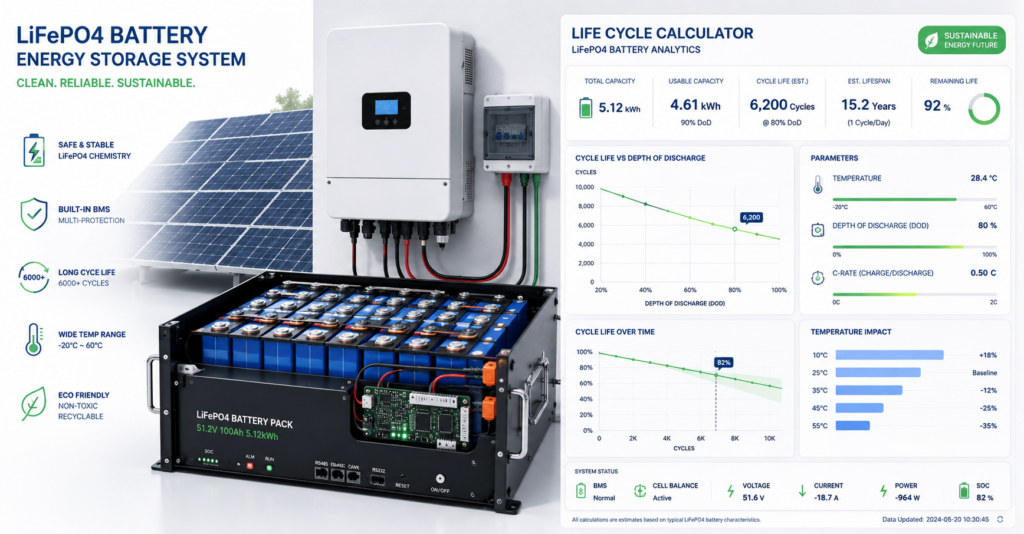
For example, a Battery Energy Storage System may include:
- 100 kWh battery capacity
- LiFePO4 battery chemistry
- 95% round-trip efficiency
- IP55 enclosure protection
- Integrated Battery Management System
- Remote monitoring capability
- 10-year warranty
- 5,000-cycle design life
Features are important because they help customers understand and compare products.
Moreover, technical buyers, engineers, and procurement teams often require detailed specifications before making a purchasing decision.
The first level of the Three Tiers of Selling focuses on features and helps customers understand exactly what a product can do.
A feature-focused salesperson might say:
“Our energy storage system uses LiFePO4 cells, has a 100 kWh capacity, 95% round-trip efficiency, an integrated BMS, and remote monitoring.”
This statement demonstrates product knowledge.
However, the customer may still wonder:
Why does this matter to me?
That question separates product knowledge from sales effectiveness.
A specification provides information. However, it does not automatically communicate value.
Therefore, the salesperson must translate each feature into something meaningful for the customer.
However, technical specifications alone can create confusion when customers do not understand what they mean. As I discussed in People Don’t Buy What They Don’t Understand – Here’s Why It’s Costing You Sales, customers are unlikely to buy what they cannot clearly understand. Therefore, salespeople must turn complex features into simple, meaningful value.
Why Feature-Focused Salespeople Often Get Stuck
Many salespeople focus heavily on features because features feel safe.
First, they are objective and easy to verify. In addition, their measurable nature makes them easier to communicate during a sales conversation. As a result, many salespeople can memorize and repeat the same specifications to multiple prospects.
However, customers are not simply buying a datasheet.
Instead, they are usually buying a solution to a problem.
Moreover, they may be looking for greater efficiency, lower risk, improved reliability, or a better business outcome.
Therefore, a good salesperson explains what the product does. By contrast, a stronger salesperson explains why it matters.
Tier 2 of the Three Tiers of Selling: Great Salespeople Focus on Outcomes
What Are Outcomes in Sales?
Outcomes explain what the customer can achieve by using the product.
This approach is often called outcome-based selling.
Instead of asking only:
“What does our product do?”
Great salespeople also ask:
“What does the customer want to accomplish?”
The same product can create different outcomes for different customers.
For example, a Battery Energy Storage System may help one customer:
- Reduce electricity costs
- Avoid peak demand charges
- Increase solar self-consumption
- Improve energy independence
- Reduce diesel generator usage
- Provide backup power
- Improve operational resilience
The product remains the same. However, the customer’s desired outcome may be completely different.
In technical industries such as renewable energy and battery energy storage systems, customers need more than a list of specifications. They need a clear understanding of performance, risk, long-term value, and the support available after the sale. This is especially important when evaluating complex systems involving batteries, power electronics, control systems, safety requirements, and long-term operational reliability.
The second level of the Three Tiers of Selling moves beyond specifications and focuses on the practical results customers want to achieve.
Translating Features Into Outcomes
Consider this example.
Feature: LiFePO4 battery chemistry.
Outcome: Longer service life, improved thermal stability, and potentially lower operational risk.
Now consider another example.
Feature: Remote monitoring.
Outcome: The customer can identify potential issues earlier, reduce unnecessary site visits, and improve system visibility.
Similarly:
Feature: 95% round-trip efficiency.
Outcome: More stored energy remains available for use, which can improve the economic performance of the energy storage system.
This is where a salesperson becomes more valuable.
Instead of repeating technical information, they interpret what the information means for the customer.
The Outcome-Focused Sales Conversation
A feature-focused salesperson may say:
“Our BESS has 95% round-trip efficiency.”
A great salesperson may instead say:
“The system is designed to minimize energy losses, helping you retain more usable energy during charging and discharging. As a result, you can improve the overall economics of your energy storage investment.”
Both statements are technically relevant.
However, the second statement communicates business value.
Therefore, it answers a more important customer question:
What does this mean for me?
Why the Three Tiers of Selling Matter: Features vs Outcomes
Customers rarely buy a product simply because it has impressive specifications.
Instead, they want a meaningful improvement in their current situation.
For example, customers may want to:
- Save money
- Reduce risk
- Improve productivity
- Increase reliability
- Protect business operations
- Grow revenue
- Save time
- Simplify complex processes
- Meet regulatory requirements
These are outcomes.
For instance, a buyer may purchase an industrial battery because they need energy storage capacity. However, their deeper objective may be to keep a factory operating during grid outages.
The battery is the product.
Meanwhile, business continuity is the outcome.
Therefore, understanding this difference is essential.
When salespeople focus only on the product, they compete with every similar product. In contrast, when they focus on the customer’s outcome, they become part of the customer’s decision-making process.
Tier 3 of the Three Tiers of Selling: Exceptional Salespeople Focus on Feelings
The Highest Level of Selling Is Emotional Connection
Exceptional salespeople understand that customers are human beings.
This remains true even in complex B2B transactions.
A procurement manager may fear choosing the wrong supplier.
Meanwhile, a project manager may worry about delays.
A CEO may be concerned about investment risk.
Similarly, an engineer may worry about technical reliability.
These concerns influence the buying decision.
Therefore, the highest level of selling involves understanding how customers feel before, during, and after the purchasing process.
The highest level of the Three Tiers of Selling focuses on feelings, trust, confidence, and the emotional experience of working with a salesperson.
However, emotional selling should not involve manipulation.
Instead, ethical emotional selling is based on empathy, understanding, and genuine customer support.
What Do Customers Want to Feel?
Customers often want to feel safe, respected, understood, confident, supported, and in control.
In addition, many buyers want reassurance that their decision will protect their business and professional reputation.
Exceptional salespeople create these feelings through competence, communication, and trust.
For example, one salesperson might say:
“Our product is better because we have better specifications and a lower price.”
By contrast, another salesperson might say:
“I understand that this project is important to your business. Before recommending anything, I want to understand your technical requirements, operating conditions, risks, and long-term objectives. If our solution is not the right fit, I will tell you honestly.”
The second salesperson does more than create product interest.
Instead, they create trust.
The Three Tiers of Selling in Practice: A BESS Example
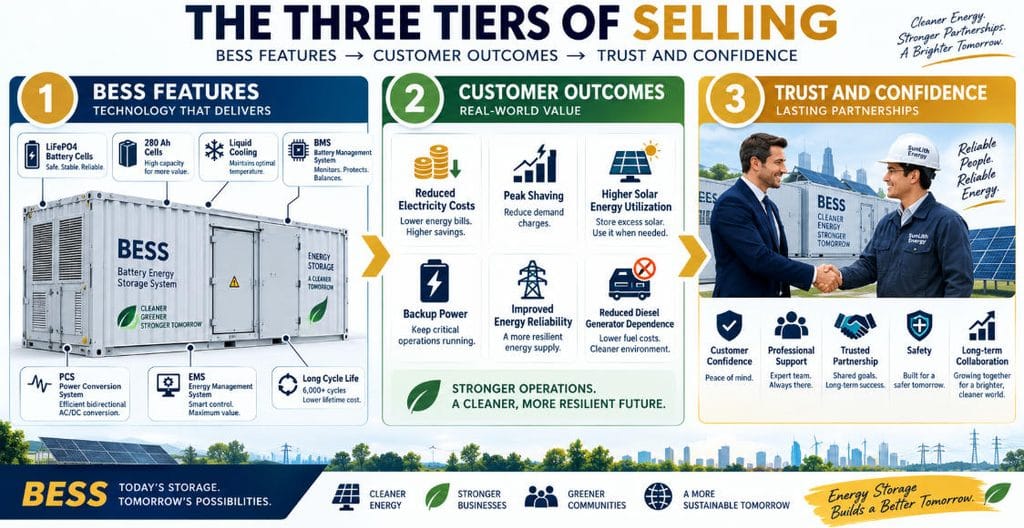
Consider a customer looking for a Battery Energy Storage System.
Good Salesperson: Features
“Our system uses 280 Ah LiFePO4 cells, has a 20-foot container design, liquid cooling, an integrated BMS, PCS, EMS, and a 5,000-cycle design life.”
The customer learns about the product.
Great Salesperson: Outcomes
“The system is designed to provide reliable energy storage while helping you reduce peak electricity costs, improve solar utilization, and maintain power availability during outages.”
The customer understands the business value.
Exceptional Salesperson: Feelings
“I understand that choosing the wrong energy storage partner could affect your project timeline and investment. We will work with your technical team from system design through commissioning, while remaining transparent about risks, limitations, and performance expectations. You will also have a clear point of contact throughout the project.”
Now the customer feels supported.
This example clearly demonstrates the progression within the Three Tiers of Selling.
Features help customers understand the product. Meanwhile, outcomes demonstrate the practical value it can deliver. Ultimately, feelings and emotional trust strengthen the customer relationship.
Why Exceptional Salespeople Build Trust Before Asking for the Sale
Trust is one of the most valuable assets in sales.
After all, customers do not only evaluate the product.
They also evaluate the salesperson and the company behind it.
As a result, they may silently ask:
- Do they understand my needs?
- Are they technically competent?
- Are they honest?
- Will they support me after the purchase?
- Can I trust their promises?
- Are they focused on helping me or simply closing a deal?
Exceptional salespeople answer these questions through consistent actions.
For example, trust grows when salespeople:
- Respond when promised
- Provide accurate information
- Admit when information is unavailable
- Discuss product limitations honestly
- Avoid exaggerated claims
- Respect the customer’s time
- Follow up consistently
- Recommend suitable solutions
- Support customers after the sale
Therefore, trust is not created by simply saying, “You can trust me.”
Instead, it develops through consistent behavior over time.
The Role of Empathy in the Three Tiers of Selling
Empathy is the ability to understand another person’s perspective.
In sales, this means understanding:
- What the customer needs
- What the customer fears
- What success looks like
- What pressures they face
- What risks they want to avoid
Empathetic salespeople ask better questions.
For example:
“What would happen if this system failed during peak operations?”
“What is your biggest concern about this project?”
“How will you measure whether this investment is successful?”
“What risks are most important to your management team?”
These questions reveal the emotional and business context behind a technical requirement.
For instance, a request for a 100 kWh BESS is rarely just a request for a 100 kWh BESS.
There is usually a deeper reason.
The salesperson’s responsibility is to discover that reason.
This is also why consultative selling has become increasingly important. Instead of immediately promoting a product, the salesperson first attempts to understand the customer’s requirements and priorities. HubSpot Sales Resources provides additional guidance on sales processes and customer engagement.
How to Move Through the Three Tiers of Selling
Step 1: Master the Product
You cannot move beyond features if you do not understand them.
Learn the:
- Specifications
- Limitations
- Applications
- Installation requirements
- Performance characteristics
- Certifications
- Maintenance requirements
- Competitive differences
However, do not stop at memorization.
Instead, ask:
“What does this specification actually mean for the customer?”
This question helps convert product knowledge into customer value.
Step 2: Understand the Customer’s Desired Outcome
Before presenting the product, understand the objective.
Ask:
- What problem are you trying to solve?
- What result are you looking for?
- What is the current situation costing you?
- What would success look like?
- Why is this project important now?
These questions move the conversation from technical specifications to customer outcomes.
Consequently, the sales conversation becomes more relevant and personalized.
Step 3: Understand What Is Emotionally at Stake
Look beyond the technical requirement.
Ask:
- What concerns you most about this decision?
- What risks are you trying to avoid?
- What happens if the project fails?
- What level of support do you expect?
- What would make you confident in moving forward?
The answers reveal the third tier of the Three Tiers of Selling.
They help you understand what the customer needs to feel.
Step 4: Communicate With Honesty
Exceptional salespeople do not pretend that every product is perfect.
Instead, they openly discuss:
- Limitations
- Risks
- Requirements
- Trade-offs
- Alternative solutions
Honesty may occasionally slow a sale.
However, it builds long-term credibility.
A lost deal can sometimes return.
Lost trust rarely does.
Step 5: Stay Present After the Sale
The strongest customer relationships do not end when the purchase order is received.
Instead, post-sales support becomes part of the customer experience.
Customers remember:
- Who answered the phone
- Who solved problems
- Who communicated clearly
- Who took responsibility
- Who disappeared after receiving payment
Therefore, exceptional salespeople understand that the sale is not the end of the relationship.
It is the beginning of a longer customer journey.
The Three Tiers of Selling in Technical and B2B Sales
Technical sales requires a balance between detailed knowledge and strong communication.
Customers may need specifications, drawings, test reports, certifications, and performance data.
Therefore, features remain important. However, technical information alone does not close every sale.
For example, customers evaluating a Battery Energy Storage System (BESS) may compare battery capacity, voltage, chemistry, BMS, PCS, EMS, safety systems, and system performance. However, exceptional salespeople must also explain how these technical features connect with the customer’s operational goals and concerns.
The Three Tiers of Selling are especially useful in technical industries because customers need both accurate information and confidence in the people supporting the solution.
A successful technical salesperson can connect:
Feature → Capability → Outcome → Feeling
For example:
Feature
Integrated Battery Management System.
Capability
The system monitors battery voltage, temperature, current, and other operating conditions.
Outcome
This monitoring can support safer and more reliable battery operation.
Feeling
As a result, the customer may feel more confident that the investment is being professionally managed and that key operational risks are being addressed.
This sequence transforms technical information into customer value.
In complex B2B environments, customers often evaluate both the technical solution and the supplier relationship. McKinsey Growth, Marketing & Sales Insights publishes research and analysis on customer experience, growth, and B2B sales.
Common Mistakes When Using the Three Tiers of Selling
Mistake 1: Talking Too Much About the Product
Customers do not always need more specifications.
Sometimes they need more understanding.
Therefore, listen before presenting.
Mistake 2: Assuming Price Is the Only Decision Factor
A lower price can win a transaction.
However, trust, reliability, technical capability, service, and reduced risk can strongly influence purchasing decisions.
In addition, the lowest initial price may not always create the lowest long-term cost.
Mistake 3: Using Generic Benefits
A generic benefit is better than a long list of unexplained specifications.
However, a personalized outcome is more powerful.
Therefore, connect the product directly to the customer’s specific priorities.
Mistake 4: Ignoring Customer Emotions
Customers may never directly say:
“I am afraid of making the wrong decision.”
Instead, they may repeatedly ask about:
- Warranty
- Certifications
- References
- Testing
- Technical support
- Delivery schedules
- Failure rates
These questions may reveal deeper concerns.
Therefore, exceptional salespeople listen to what is behind the question.
A Simple Three Tiers of Selling Framework
Every effective sales conversation can include three layers.
1. Sell the Product
Explain:
“Here is what it does.”
2. Sell the Result
Explain:
“Here is what it can help you achieve.”
3. Sell the Relationship
Communicate:
“Here is how we will support you and why you can feel confident working with us.”
This is the practical application of the Three Tiers of Selling.
It does not mean using emotional language in every sentence.
Instead, it means recognizing that important purchasing decisions involve both logic and emotion.
Modern sales organizations increasingly focus on personalized customer engagement and relationship management. Salesforce Sales Resources provides additional insights into sales processes, customer relationships, and sales technology.
The Three Tiers of Selling: Final Comparison
Good Salespeople say:
“Our product has these features.”
Great Salespeople say:
“Our product can help you achieve these outcomes.”
Exceptional Salespeople say:
“I understand what is important to you, and you can feel confident that I will support you throughout this process.”
The progression is simple.
Features create knowledge.
Outcomes create value.
Feelings create trust.
Therefore, exceptional sales performance requires more than product knowledge.
It requires understanding people.
My Experience: Selling Beyond Technical Specifications
Through my work in renewable energy, battery energy storage, lithium batteries, sourcing, procurement, and international business development, I have worked with products that can be highly technical and complex.
In these industries, customers often begin by asking about specifications, certifications, capacity, efficiency, pricing, and technical performance. However, the most important conversations often go beyond the datasheet.
Customers also want to understand the business outcome. They want to know whether a solution will reduce risk, improve reliability, support long-term operations, and deliver real value.
More importantly, customers want to feel confident in the people and companies they choose to work with. They want transparent communication, realistic expectations, reliable support, and the confidence that someone will take responsibility when challenges arise.
This is why I believe the Three Tiers of Selling are particularly important in complex B2B and technical industries. Features explain the product. Outcomes explain the value. Feelings build the trust that can create long-term business relationships.
Conclusion: Mastering the Three Tiers of Selling
The Three Tiers of Selling provide a simple but powerful framework for improving sales performance.
Good salespeople understand products. Great salespeople, however, go further by understanding customer outcomes. Exceptional salespeople ultimately understand the people behind the purchasing decision.
Customers want more than technical specifications. They also expect practical solutions that address real challenges. Moreover, reliable results are essential when making an important purchasing decision. Above all, customers want confidence that they are making the right choice.
Therefore, the strongest salespeople combine three important elements:
Product knowledge + Customer outcomes + Human trust
A customer may initially buy a product because of what it does. However, they may choose one supplier over another because of the outcomes the solution can help them achieve.
Ultimately, long-term customer loyalty often depends on how the relationship makes the customer feel.
That is the highest level of the Three Tiers of Selling.
Frequently Asked Questions About the Three Tiers of Selling
What are the Three Tiers of Selling?
The Three Tiers of Selling are features, outcomes, and feelings. Good salespeople explain product features, great salespeople focus on customer outcomes, and exceptional salespeople build trust and emotional connection.
Why are features important in sales?
Features are important because they explain what a product has, does, or contains. However, features alone may not explain why those capabilities matter to the customer.
What is outcome-based selling?
Outcome-based selling focuses on the results a customer wants to achieve. Therefore, it connects product capabilities with meaningful business, operational, or personal benefits.
What is emotional selling?
Emotional selling involves understanding customer concerns, motivations, and desired feelings. Ethical emotional selling focuses on empathy, confidence, trust, and long-term customer relationships.
Why do customers need to trust salespeople?
Customers often face financial, professional, technical, and operational risks when making purchasing decisions. Therefore, trust reduces uncertainty and helps customers feel more confident about the decision.
Can technical salespeople use the Three Tiers of Selling?
Yes. Technical salespeople can use the Three Tiers of Selling by connecting product specifications with system capabilities, customer outcomes, and the confidence created through professional support.
How can I become an exceptional salesperson?
Develop deep product knowledge, ask better customer questions, understand desired outcomes, listen to customer concerns, communicate honestly, manage expectations, and provide consistent support before and after the sale.
In complex technical industries, professional guidance and long-term support can help customers reduce uncertainty throughout the buying process. To learn more about my professional background and experience, you can connect with me on LinkedIn.