Batteries

LFP Battery Life Cycle Calculator: Estimate Real Battery Lifespan

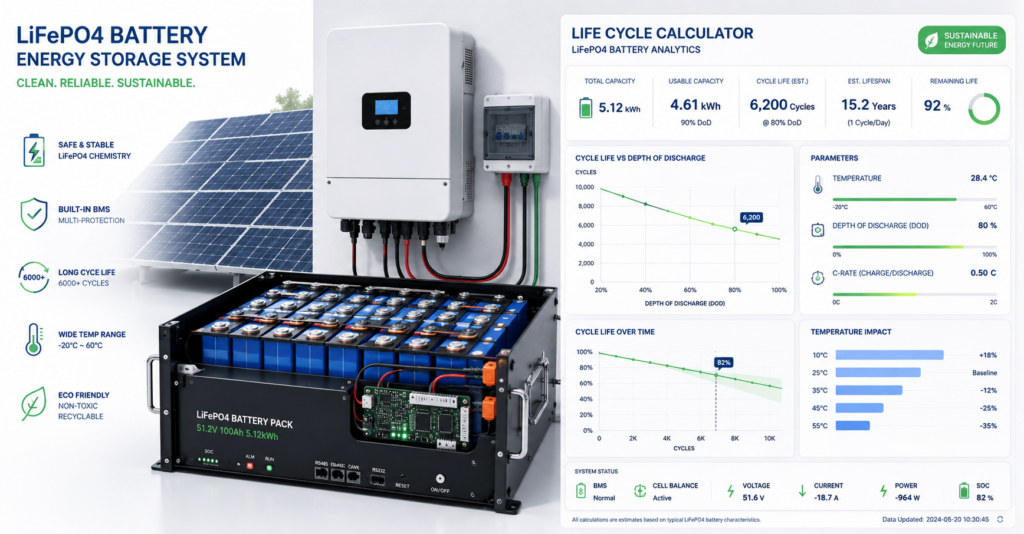
LFP Battery Life Cycle Calculator showing battery lifespan based on temperature, depth of discharge, and charging rates.

An LFP Battery Life Cycle Calculator helps estimate how long a Lithium Iron Phosphate battery will last under real-world conditions. While manufacturers often advertise 4,000 to 8,000 cycles, actual battery life depends on temperature, depth of discharge, and charging rates. Therefore, using an LFP Battery Life Cycle Calculator provides a more realistic lifespan estimate than relying on datasheet values alone.

Whether you use a battery for solar energy storage, backup power, or a Battery Energy Storage System (BESS), understanding battery degradation can help reduce costs and improve performance.

Advanced LFP Battery Life Cycle Calculator

Adjust temperature, Depth of Discharge (DoD), and charge/discharge currents to see how they impact your battery’s lifespan relative to its datasheet rating.

1. Datasheet Baseline Specs
e.g., 4000 cycles
Usually 25°C
Usually 80% or 100%
Usually 0.5C or 1C
2. Operational Conditions (Your Use Case)

Estimated Operational Lifetime

Fill in the fields and click calculate to view the breakdown.


What Is an LFP Battery Life Cycle Calculator?
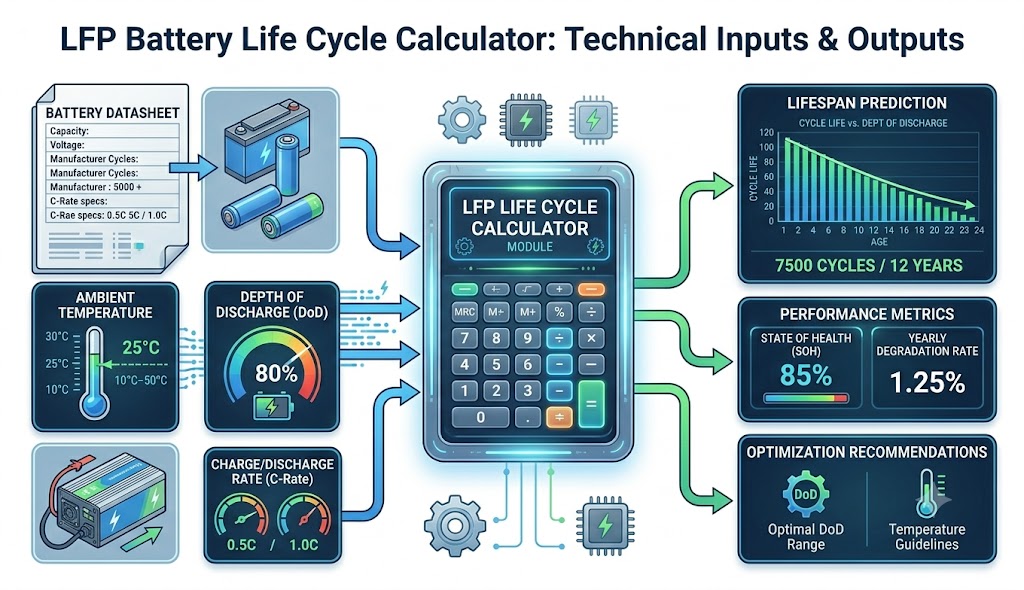
Diagram explaining how an LFP Battery Life Cycle Calculator estimates battery lifespan.

An LFP Battery Life Cycle Calculator is a tool that estimates battery lifespan based on actual operating conditions.

Most battery manufacturers publish cycle-life ratings using laboratory testing. However, batteries rarely operate under perfect conditions in the real world.

For example, batteries may experience:

  • High summer temperatures
  • Cold winter weather
  • Deep daily discharges
  • Fast charging sessions
  • Heavy load demands

As a result, actual battery lifespan can be very different from the advertised cycle count.

An LFP Battery Life Cycle Calculator accounts for these factors and provides a more accurate prediction.


Why Use an LFP Battery Life Cycle Calculator?

Many battery owners assume their battery will achieve the cycle life shown on the datasheet.

However, several operating conditions can shorten battery lifespan.

Therefore, estimating real-world performance is important before investing in a battery system.

An LFP Battery Life Cycle Calculator can help you:

  • Estimate battery lifespan
  • Compare operating scenarios
  • Improve battery maintenance
  • Reduce replacement costs
  • Optimize charging behavior

Consequently, users can make better energy storage decisions.


How Temperature Affects LFP Battery Life Cycle Calculator Results
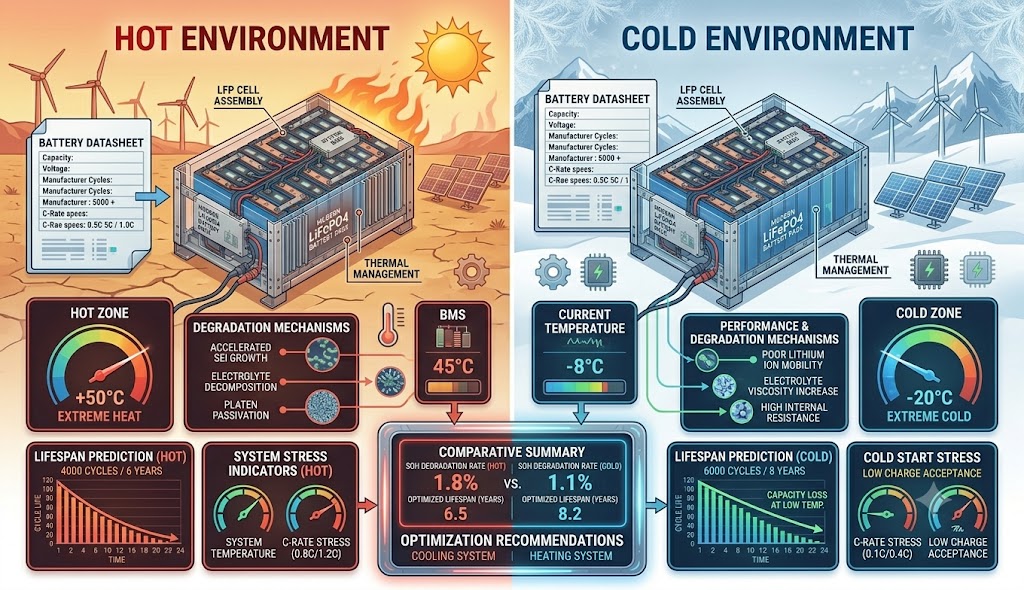
Comparison of LFP battery performance in hot and cold temperatures.

Temperature is one of the most important factors affecting battery health.

When temperatures rise, chemical reactions inside the battery accelerate. As a result, battery aging occurs faster.

High Temperatures Reduce Battery Life

Batteries operating above 35°C often experience faster degradation.

In addition, excessive heat increases:

  • Internal resistance
  • Capacity fade
  • Energy losses

Therefore, cooling systems are commonly used in commercial battery projects.

For example, modern Battery Energy Storage Systems use thermal management systems to maintain safe operating temperatures. Learn more about the engineering differences in our guide to Liquid vs Air Cooling System Use in BESS

Cold Temperatures Can Also Cause Damage

Cold weather creates different challenges.

When charging occurs below 10°C, lithium plating can develop inside the cell.

Consequently, battery capacity may decline more quickly.

Therefore, maintaining moderate temperatures is essential for maximizing lifespan.


How Depth of Discharge Affects LFP Battery Life Cycle Calculator Results
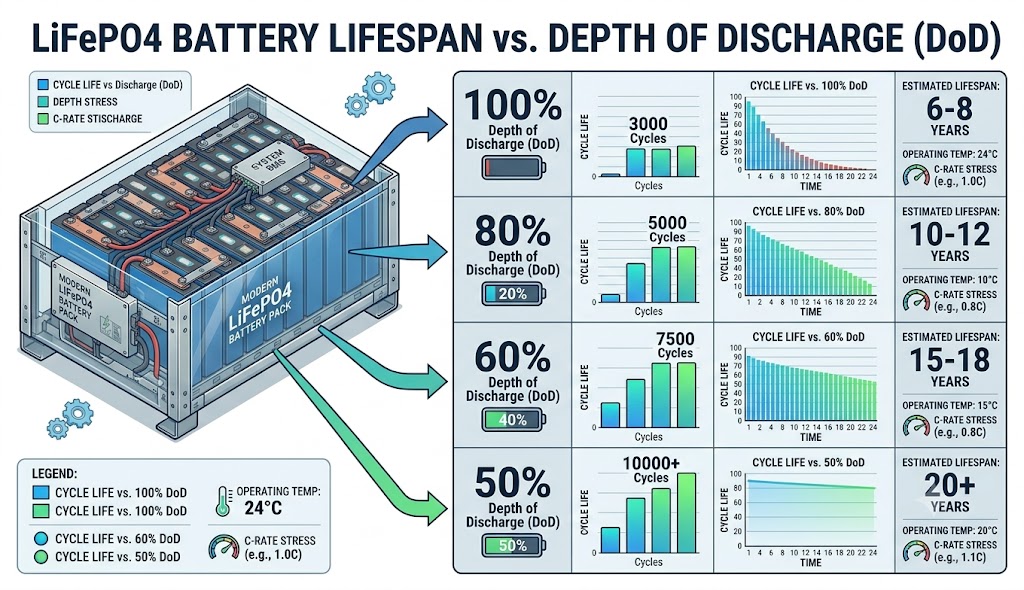
Depth of discharge comparison showing its effect on LFP battery cycle life.

Depth of Discharge (DoD) measures how much battery capacity is used during each cycle.

For example:

  • 100% DoD = Full discharge
  • 80% DoD = Partial discharge
  • 50% DoD = Shallow discharge

Generally, deeper cycles create more stress on battery materials.

As a result, batteries cycled at 100% DoD usually have shorter lifespans.

By comparison, batteries cycled at 80% DoD often achieve significantly more cycles.

Therefore, many energy storage operators limit discharge depth to extend battery life.


How C-Rate Affects LFP Battery Life Cycle Calculator Results
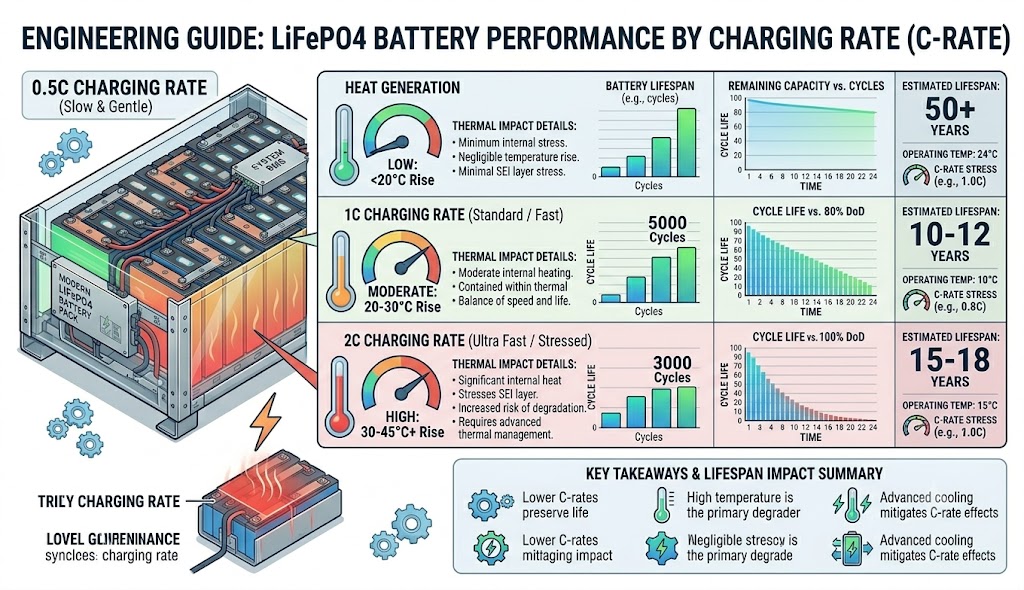
Different charging rates affecting lithium iron phosphate battery lifespan.

C-rate describes how quickly a battery charges or discharges.

For example:

  • 0.5C = Two-hour charge
  • 1C = One-hour charge
  • 2C = Thirty-minute charge

Higher C-rates increase heat generation inside the battery.

Consequently, battery degradation accelerates over time.

Although LFP batteries are known for durability, excessive charging currents still reduce lifespan. Therefore, moderate charging rates are usually recommended to preserve your system’s State of Health. For a complete deep-dive on how current affects system performance and pricing, see our comprehensive guide on BESS C-Rate Explained.


How Our LFP Battery Life Cycle Calculator Works

Our LFP Battery Life Cycle Calculator combines several battery aging factors into a single estimate.

The calculator considers:

Users simply enter their battery specifications and operating conditions.

The calculator then estimates:

  • Expected cycle life
  • Remaining battery lifespan
  • Capacity retention trends

As a result, users gain a clearer picture of long-term battery performance.


LFP Battery Life Cycle Calculator Examples

Consider two identical LFP batteries.

Example 1

Operating conditions:

  • Temperature: 25°C
  • DoD: 80%
  • Charge Rate: 0.5C

Expected lifespan:

  • Close to manufacturer rating

Example 2

Operating conditions:

  • Temperature: 40°C
  • DoD: 100%
  • Charge Rate: 2C

Expected lifespan:

  • Significantly lower than manufacturer rating

Therefore, operating conditions have a major impact on battery longevity.


How to Increase LFP Battery Lifespan

Fortunately, there are several ways to improve battery life.

Keep Batteries Cool

Whenever possible, keep battery temperatures below 35°C.

Avoid Deep Daily Discharges

Operating between 20% and 80% state of charge often improves lifespan.

Limit Fast Charging

Although fast charging is convenient, moderate charging rates generally reduce battery stress.

Choose High-Quality Battery Systems

Battery quality plays a major role in long-term performance.

Therefore, selecting premium cells and professionally engineered systems is vital for maximizing ROI. If you are designing a commercial project, explore advanced containerized battery storage solutions built specifically for long-term real-world durability.


FAQs About LFP Battery Life Cycle Calculator

What is an LFP Battery Life Cycle Calculator?

An LFP Battery Life Cycle Calculator estimates battery lifespan based on operating conditions such as temperature, depth of discharge, and charging rate.

What is an LFP Battery Life Cycle Calculator?

An LFP Battery Life Cycle Calculator estimates battery lifespan based on operating conditions such as temperature, depth of discharge, and charging rate.

How many cycles does an LFP battery last?

Most LFP batteries last between 4,000 and 8,000 cycles under standard testing conditions.

Does temperature affect battery lifespan?

Yes. High temperatures accelerate battery aging, while very low temperatures can increase charging-related damage.

Does fast charging reduce battery life?

Yes. Higher charging currents create additional heat and stress, which can shorten battery lifespan over time.

Are LFP batteries good for solar storage?

Yes. LFP batteries offer long cycle life, excellent safety, and high reliability for solar energy storage systems.


Conclusion: Use an LFP Battery Life Cycle Calculator Before You Buy

An LFP Battery Life Cycle Calculator provides a realistic estimate of battery lifespan based on actual operating conditions.

Temperature, depth of discharge, and charging rates all affect battery performance. Therefore, understanding these factors can help you maximize battery value and reduce replacement costs.

Before choosing a battery system, use the LFP Battery Life Cycle Calculator to compare different operating scenarios and make smarter energy storage decisions. For more technical guides, product updates, and clean energy insights, keep up with the latest articles on the SunLith Energy Blog

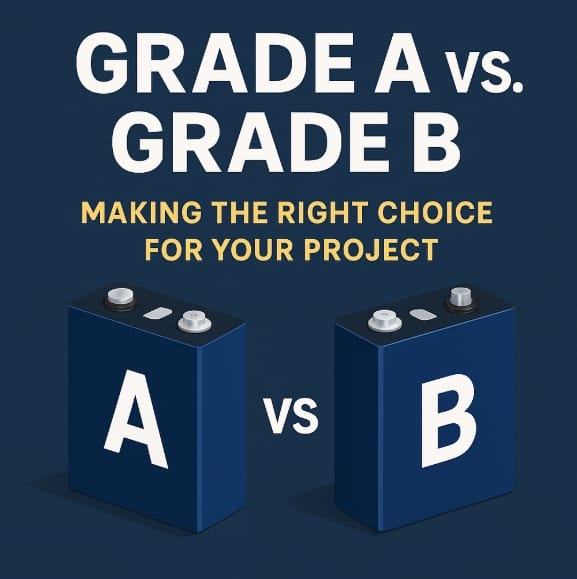
Grade A vs Grade B LiFePO4: Making the Right Choice for Your Project

Grade A vs Grade B LiFePO4

Grade A vs Grade B LiFePO4: LiFePO4 (Lithium Iron Phosphate) batteries have earned their reputation for stability, safety, and long cycle life. But if you’ve ever searched for LiFePO4 cells, you’ve probably stumbled upon the terms Grade A and Grade B.

The difference might seem minor — until it isn’t. While Grade A promises top-tier performance, Grade B cells lure buyers with tempting price tags. The result? Many buyers get stuck in the budget vs. performance dilemma.

Should you splurge for Grade A every time, or are Grade B cells sometimes a smart, cost-effective choice? Let’s break it down with facts, use cases, and practical tips.


Detailed Comparison: Grade A vs Grade B LiFePO4

1. What Defines the Grades?


2. Key Metrics Side-by-Side for Grade A vs Grade B LiFePO4

MetricGrade AGrade B
Cycle Life3500–6000+ full cycles1500–3000 cycles (may vary widely)
Capacity Retention95–100% of rated capacity85–95% of rated capacity
Internal Resistance (IR)Low and consistentMay be slightly higher and vary more
ConsistencyHigh — matched cells for balancingVariations may cause imbalance
Warranty & TraceabilityUsually verifiableRarely offered or less reliable

Use Case Scenarios for Grade A vs Grade B LiFePO4

When to Always Choose Grade A

Some applications simply can’t afford to gamble on lower-grade cells. If you depend on reliability, longevity, and maximum safety, Grade A is worth every extra penny.

Off-Grid Homes: Your solar or wind storage must deliver consistent power every day, often in harsh conditions. Low-grade cells failing prematurely can put you in the dark — literally.

Mission-Critical Systems: Medical backup, telecom base stations, and security setups must work flawlessly. Failure could mean legal liabilities or safety risks.

Electric Vehicles (EVs): High current draws, fast charging/discharging, and deep cycles demand cells that perform at peak specs.


When Grade B Might Be a Smart, Cost-Effective Choice

Grade B isn’t automatically “bad” — it depends on the project and your risk tolerance.

Hobby Projects: DIY power banks, test setups, or prototyping — if a cell underperforms, it’s not a disaster.

Occasional-Use Backups: For infrequently used backup systems where top performance isn’t critical, Grade B can stretch your budget.

Short-Term Applications: If you only need the cells for a limited time, a lower upfront cost could make more sense than paying for cycles you’ll never use.


Long-Term Costs: Think Beyond the Sticker Price

Buying Grade B cells may save you money upfront — but will they cost you more over time?

Example:

  • 4 Grade A cells ($100 each) last 10 years → Total cost: $400
  • 4 Grade B cells ($60 each) last 4–5 years → May need replacing twice in 10 years → Total cost: $480

When you add labor, downtime, and potential system failure, Grade A often pays for itself in the long run — especially for demanding or hard-to-access installations.


Tips for Sourcing Reliable Grade B Cells

If you decide Grade B is right for you, follow these best practices to avoid costly surprises:

✔️ Ask for Test Reports: Request actual capacity and IR test results for each batch — not generic data.

✔️ Check Visuals: Inspect for dents, swelling, or damaged terminals.

✔️ Buy from Reputable Resellers: Look for sellers with transparent sourcing, clear grading policies, and consistent customer reviews.

✔️ Test Yourself: Use a battery tester to confirm capacity, IR, and voltage consistency.

✔️ Document Everything: Keep records of your purchase, including test results and any warranties.


Final Thoughts: Know Your Needs, Know Your Risk

Choosing between Grade A and Grade B LiFePO4 cells isn’t about right or wrong — it’s about aligning your choice with your needs and risk tolerance.

  • Critical, long-term, or high-cycle applications? Grade A is your safest bet.
  • Budget-limited, low-demand, or experimental projects? Grade B might make sense if sourced carefully.

Whatever you choose, do your homework — and don’t let a cheap deal cost you more in the end.


Grade A vs Grade B LiFePO4 FAQs

Q: Is Grade B always recycled or used?

A: Not always. Grade B can include new but off-spec cells, or cells from canceled orders. But some sellers mix used or reclaimed cells — so always ask for clear proof.

Q: Can I mix Grade A and Grade B cells in one battery pack?

A: It’s strongly discouraged. Inconsistent IR and capacity lead to imbalance, which can cause early failure or safety issues.

Q: How can I test cells myself?

A: Use a battery analyzer to check capacity, IR, and charge/discharge curves. Tools like the ZKE Tech or similar DIY testers are popular among hobbyists.


Ready to Decide?

Knowing the real difference between Grade A vs Grade B LiFePO4 can help you make a smart, confident choice — one that matches your project’s goals, budget, and peace of mind.

Decoding Your Battery’s “Health Report”: A Simple Guide to SOC, SOH, DOD, SOP, and EOL

Battery health basics

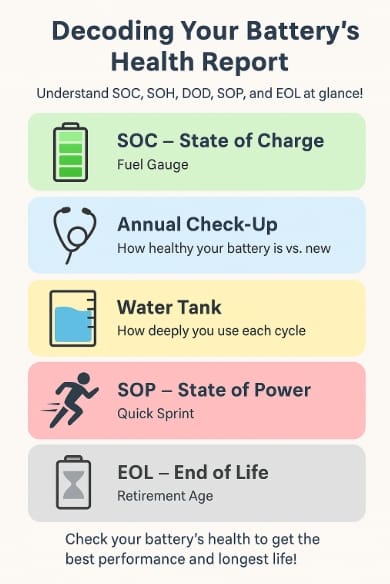
When you glance at your phone, laptop, or electric vehicle, you probably see a simple battery percentage icon and think that’s all you need to know. But your battery actually has a much deeper “Battery health report” hidden inside — and understanding it can help you get the best performance and longest life from every charge.

In this easy-to-understand guide, we’ll break down the most important battery health metrics: SOC, SOH, DOD, SOP, and EOL. We’ll use simple analogies — like a fuel gauge, a health check-up, and a retirement plan — so you can take better care of your battery, whether it’s in your smartphone, laptop, or EV.

Focus Keywords: Battery SOC explained, SOH meaning, DOD battery, SOP battery, EOL battery, battery health basics, understanding battery metrics.


Why Battery Metrics Matter

Batteries don’t just store energy — they communicate with your device and you. These key metrics help you understand how much energy is available, how healthy the battery is, how deeply you’re using it, how much power it can deliver, and when it’s time to plan for a replacement.


1. SOC (State of Charge) — Your Battery’s “Fuel Gauge”

What it means:
SOC stands for State of Charge. It tells you how much usable energy is left in your battery — just like your car’s fuel gauge shows how much gas you have left.

Analogy:
Imagine being on a long road trip. You keep an eye on the fuel gauge to decide when to stop for gas. SOC works the same way: it shows if you have enough charge to watch another video, make another call, or drive another mile.

Why it matters:
Knowing your SOC helps you plan when to plug in. For EV drivers, an accurate SOC means less range anxiety and smarter trip planning.


💚 2. SOH (State of Health) — Your Battery’s “Annual Check-Up”

What it means:
SOH means State of Health. It measures how much your battery’s capacity and performance have declined compared to when it was brand new.

Analogy:
Think of SOH like your yearly physical exam. Even if you feel fine, your doctor checks your overall health. Similarly, SOH shows whether your battery can still store and deliver energy properly.

Why it matters:
A battery with an SOH of 80% means it can hold only 80% of its original capacity. This is why your phone or EV might not last as long between charges after a few years.


🔋 3. DOD (Depth of Discharge) — How Deeply You Use It

What it means:
DOD stands for Depth of Discharge. It tells you how much of your battery’s capacity has been used up during one cycle.

Analogy:
Picture your battery as a water tank. If you use 30% of the water before refilling, your DOD is 30%. The deeper the discharge, the more water (or energy) you use each time.

Why it matters:
Frequent deep discharges can shorten a battery’s lifespan. For example, draining your phone to 0% every day wears it out faster than topping it up when it hits 30–40% SOC.


🚗 4. SOP (State of Power) — Can It Deliver a Quick “Sprint”?

What it means:
SOP means State of Power. It measures how much power your battery can deliver at a moment’s notice — critical for devices that need sudden bursts of energy.

Analogy:
Think of SOP like an athlete’s ability to sprint. A healthy battery can deliver high power instantly — like an EV accelerating quickly onto a highway or your phone boosting performance for a game.

Why it matters:
Low SOP can mean reduced performance. For example, your EV might have slower acceleration, or your tools might have less torque.


☠️ 5. EOL (End of Life) — Knowing When It’s Time for Retirement

What it means:
EOL stands for End of Life. It’s the point where your battery’s performance has degraded so much that it no longer meets its original purpose.

Analogy:
EOL is like a retirement age for your battery. After years of hard work and many charge cycles, your battery can’t hold enough energy or deliver power effectively. For lithium-ion batteries, this often happens when SOH drops below 70–80%.

Why it matters:
Knowing your battery’s EOL helps you plan ahead. For an EV, it could mean budgeting for a battery replacement before your range becomes too limited. For a laptop, it might mean deciding whether to replace the battery or upgrade your device.


Your Battery’s Health Report — Quick Recap

Here’s a simple way to remember what each metric means:


🔑 Everyday Tips to Extend Battery Life and Delay EOL

Now that you know how to read your battery’s “health report,” here are simple habits to help it stay healthy:

  • Avoid deep discharges: Try to keep your battery between 20%–80% SOC.
  • Charge smart: Use certified chargers and avoid unnecessary fast charging.
  • Keep it cool: Heat is a battery’s enemy — avoid leaving devices in hot cars.
  • Monitor SOH: Many EVs and laptops display SOH; check it regularly.
  • Plan for EOL: Budget for battery replacements for large investments like EVs.

FAQ: Understanding Battery Metrics

Q1: What’s the best SOC range for daily charging?

A: For most lithium-ion batteries, staying between 20%–80% SOC helps extend lifespan.

Q2: How can I check my battery’s SOH?

A: Many EVs and some laptops show SOH in settings. Otherwise, check with your service provider.

Q3: Does high DOD always reduce battery life?

A: Frequent deep discharges accelerate wear, so shallow discharges are better for longevity.

Q4: Why does SOP drop over time?

A: As batteries age, internal resistance increases, which reduces their ability to deliver quick bursts of power.

Q5: What should I do when my battery reaches EOL?

A: Plan for a replacement or upgrade — continuing to use an old battery can lead to unexpected shutdowns or poor performance.


Final Thoughts

Understanding your battery’s SOC, SOH, DOD, SOP, and EOL turns a simple percentage icon into a powerful tool for smarter use. By keeping an eye on these metrics, you can extend your battery’s life, reduce surprises, and get the best performance from every charge.